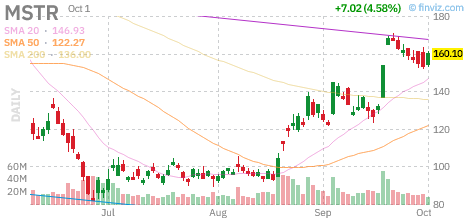
Microstrategy stock rose 4.48% on October 1st, trading near $159.96 during the session, up from Wednesday's close of $153.09. The company now operates as Strategy (ticker: MSTR), though its distinction as a public firm holding the largest Bitcoin treasury remains unchanged.
Attributing today's move to a single driver proves difficult. Softer-than-expected US inflation readings and Bitcoin strength both feature in explanations, along with a B. Riley price-target increase announced the previous day. The following details what can be verified.
Where Microstrategy Stands After Today
Market cap stands near $63.8 billion. Trading volume exceeded 13 million shares; mid-September daily average was around 23 million shares, and intraday totals could grow before the close.
While today's move is substantial, it trails the 52-week high of $365.21 by more than half—56% below the peak. The one-year return stands at -52.74%; year-to-date performance is +5.26%.
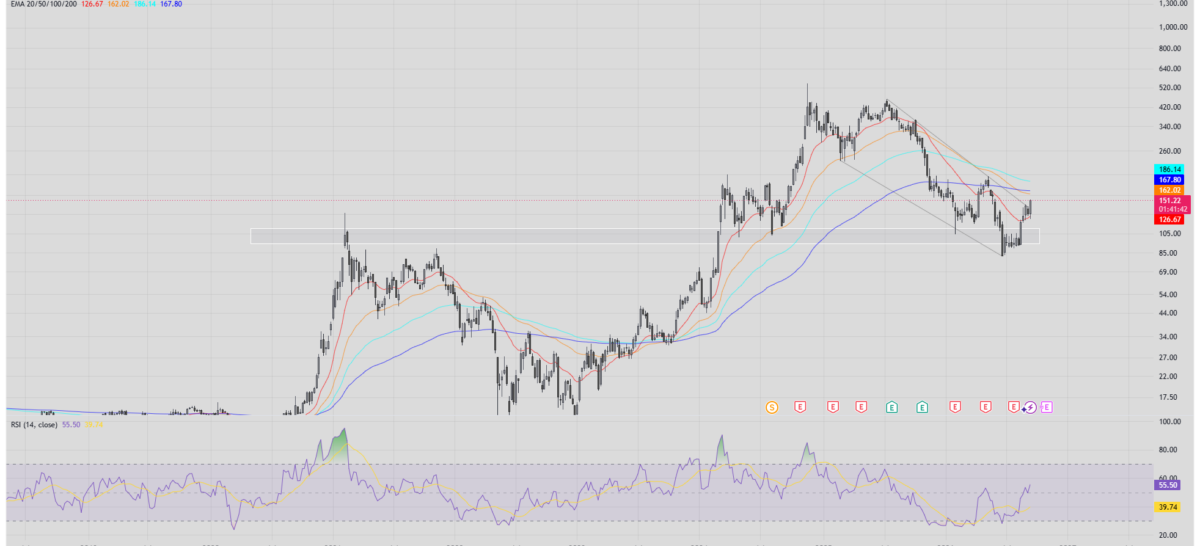
The weekly chart above shows the 200-day moving average at $167.80 as of September 18. According to Cointelegraph, the stock stalled near the $167 level last week. With today's price in the $160 range, the moving average sits just overhead.
Multiple Drivers Converged
October 1st reports cited softer inflation. Cointelegraph reported MSTR up 3% to the mid-$157s on that day, attributing strength to softer-than-expected US inflation readings that eased fears of Fed tightening.
The previous day brought separate news. On September 30th, B. Riley raised its price target from $175 to $195 (maintaining a Buy rating), according to trading information service Tim Sikkes. MSTR rose 4.12% that day. The same report noted Strategy purchased 1,665 Bitcoin for approximately $142.7 million, bringing total holdings to 847,666 Bitcoin. However, this purchase was not independently verified from other outlets; treat as single-source reporting.
Market factors also converge. The stock tends to outperform Bitcoin itself when Bitcoin rallies—a pattern evident in August and September. Today's gain reflects the combined effect of Bitcoin strength and interest-rate expectations. The precise contribution of each factor cannot be isolated.
Why This Stock Outpaces Bitcoin Moves
Strategy began as a software vendor; it now operates as a Bitcoin accumulator. Its beta on Yahoo Finance is 3.60—meaning it typically moves more than three times as much as the market when the market moves 1%.
Financial structure amplifies this effect. Trailing twelve-month net loss shows -$31.37 billion, largely reflecting unrealized Bitcoin losses on the balance sheet rather than cash outflows. Conversely, Bitcoin gains immediately shrink this deficit.
This dynamic was tested earlier this year. During the week of August 3-9, Strategy sold 1,690 Bitcoin for approximately $108.6 million. Context: the company needed cash for preferred dividends and interest payments.
The market reaction proved dramatic. When Bitcoin jumped from below $65,000 to near $70,000 on August 19th, MSTR surged 12.15%. CEO Pong Le indicated Bitcoin purchases would resume after a seven-week pause, while Michael Saylor stated that investors should prepare for a challenging period ahead. Optimism and caution arrived the same day.


Three Surges in Two Months: What Drove Them
| Date (US) | Move | Reported Driver |
|---|---|---|
| Aug 19 | +12.15% | Bitcoin rebound, resumption of purchases signaled |
| Sept 18 | ~+13% | Strategic Bitcoin Reserve Act advanced; SEC temporary tokenized-stock exemption |
| Oct 1 | +4.48% (intraday) | Softer inflation, Bitcoin momentum |
On September 18th, the US House Financial Services Committee advanced the Strategic Bitcoin Reserve Act (H.R. 8957), and reports emerged of the SEC granting a temporary exemption for tokenized stock trading. That day's intraday high for MSTR was $150.89—a 13% move driven by regulatory headlines.
While the advances are striking, the current level remains relatively modest. The stock has nearly doubled from the 52-week low of $81.81 but remains distant from last year's autumn highs. Today's ~4% gain represents one step within this larger recovery.
Analyst Outlook and Key Headwinds
Analyst consensus target on Yahoo Finance is $229.87, representing more than 40% upside from current levels. FactSet consensus average is cited at $234.11; Barclays maintains an Overweight rating. Targets are forward guidance and offer no guarantee prices will follow.
Two factors could restrain upside. One is MSCI. According to Cointelegraph, MSCI is reviewing index inclusion for MSTR and other stocks, with a decision announcement set for November 11. Exclusion could trigger outflows from index-tracking funds, a downside risk noted by observers. CEO Pong Le has publicly criticized MSCI for displaying an anti-Bitcoin stance.
The other is capital structure. Strategy must fund preferred dividends and interest payments in cash, a burden evident in the August selling. Having funded Bitcoin purchases through equity issuance, the company finds fundraising easier when the stock rises and harder when it falls. Increased share issuance also poses dilution risk to existing shareholders.
The next earnings release is expected October 29 per Yahoo Finance; the official date should be confirmed via company filings.
Where Does This Stock Stand Now?
Today's Microstrategy move appears to reflect Bitcoin strength and interest-rate expectations, with no evidence of a fundamental shift in the company's financial position. While the August Bitcoin sale has improved cash, unrealized losses and dilution concerns persist.
Two near-term catalysts deserve watching: whether the stock closes above the $167 200-day moving average, and the November 11 MSCI announcement.
For a stock driven so heavily by Bitcoin, daily 4% moves may be mere noise. Remember one number: 167.
This US-listed stock analysis is factual reporting, not investment advice or a buy/sell recommendation. Investment decisions and results remain your responsibility.
#Microstrategy #MSTR #Strategy #Bitcoin #BitcoinStock #USStocks #StockInFocus #USMarkets #NASDAQ #BitcoinTreasury #MSCI #200DayMovingAverage #PongLe #Cryptocurrency #USEquities #MicrostrategyStock
댓글
댓글 쓰기